> For the complete documentation index, see [llms.txt](https://help.eventool.com/llms.txt). Markdown versions of documentation pages are available by appending `.md` to page URLs; this page is available as [Markdown](https://help.eventool.com/en/dashboard/analytics/usage-data.md).
# Usage data
## Analysis of User Behaviour in Eventool
The **App Usage Data** section in the Eventool admin panel provides organisers with detailed insights into how attendees interact with the application. This section is ideal for understanding user behaviour and evaluating the impact of the app's various features and sections. Here we explain how to interpret and use this data.
### Access to the app usage data section
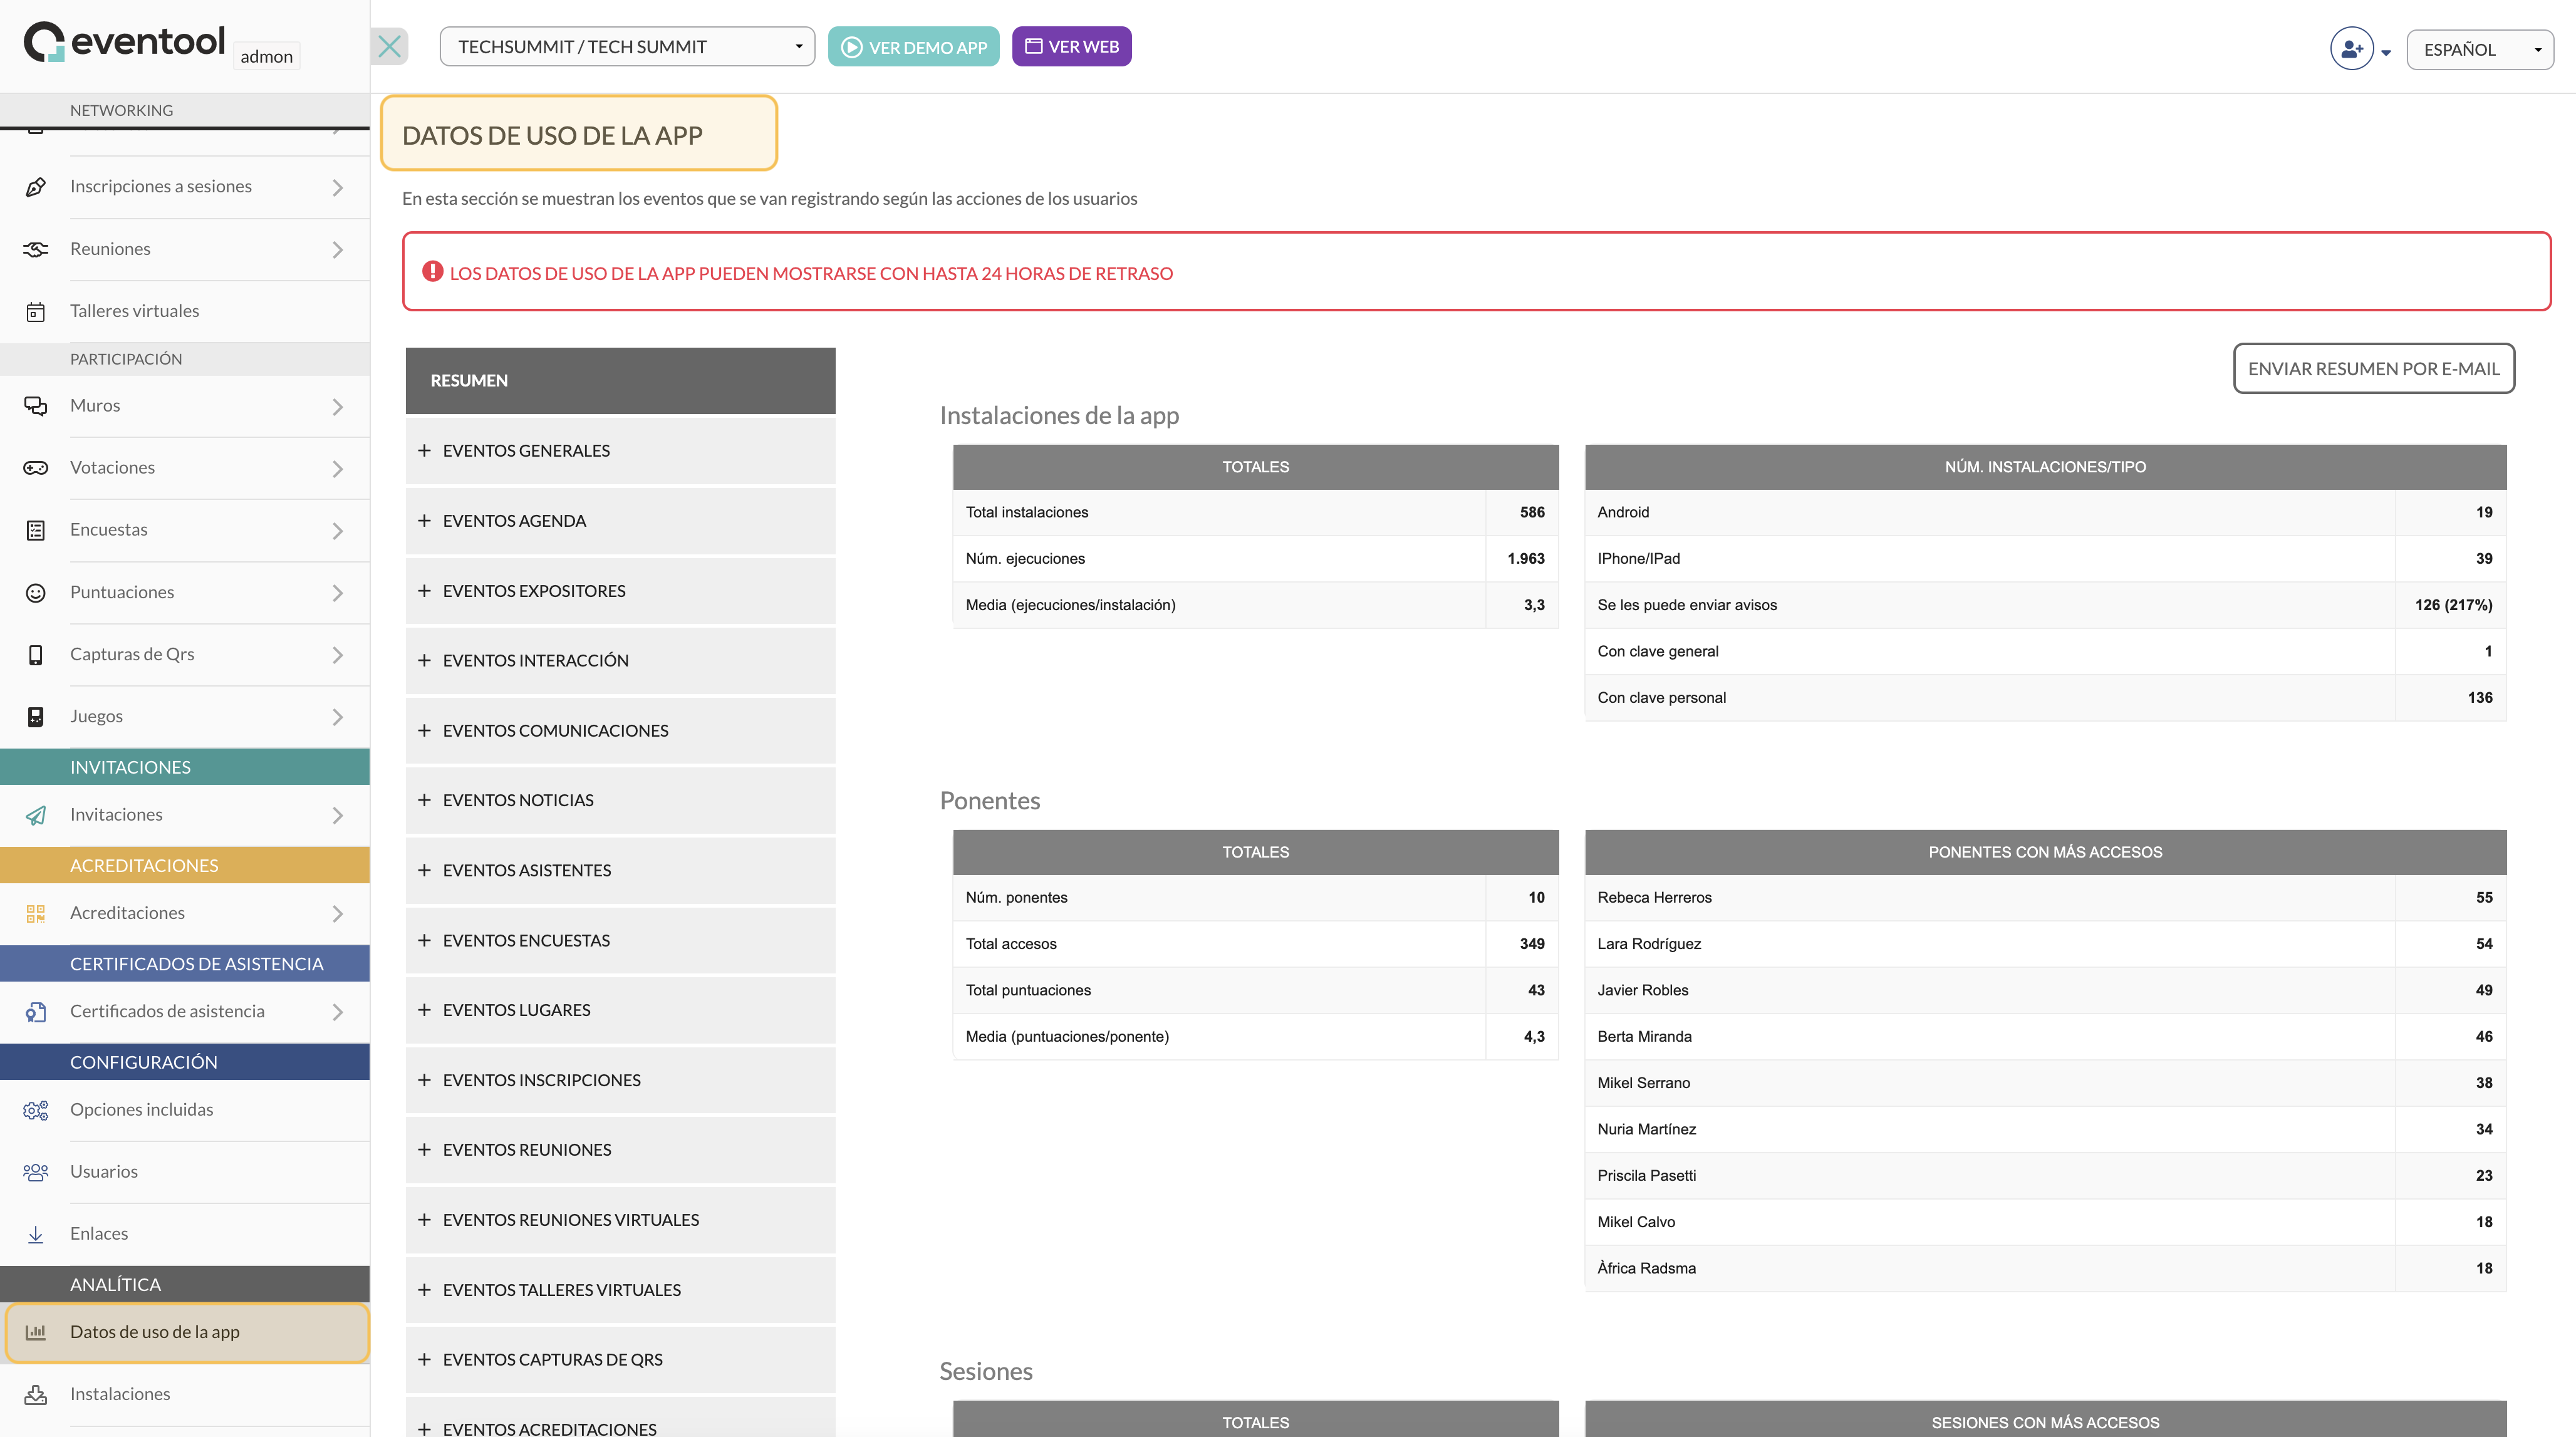
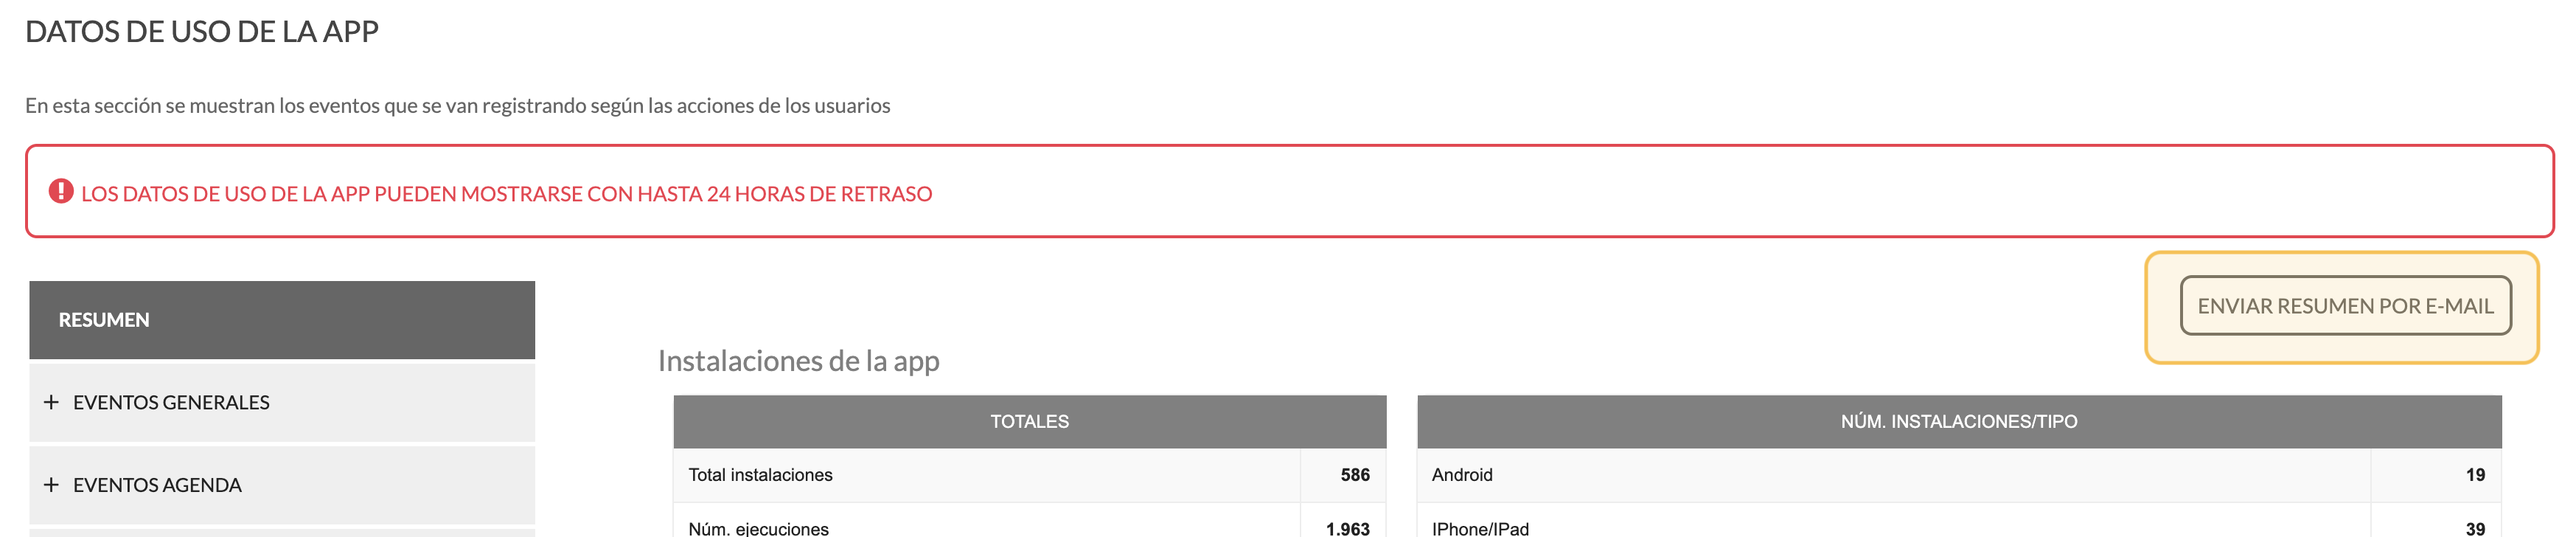
To access usage data, log in to your event's administration panel in Eventool and select the **Analytics > App usage data** option in the left-hand menu. Key statistics are shown here and updated regularly, although it is important to note that the **data may be delayed by up to 24 hours**.
### Summary of general statistics
At the top of the section, you will find an overview of the app usage statistics. This overview includes important metrics for evaluating the level of interaction among attendees:
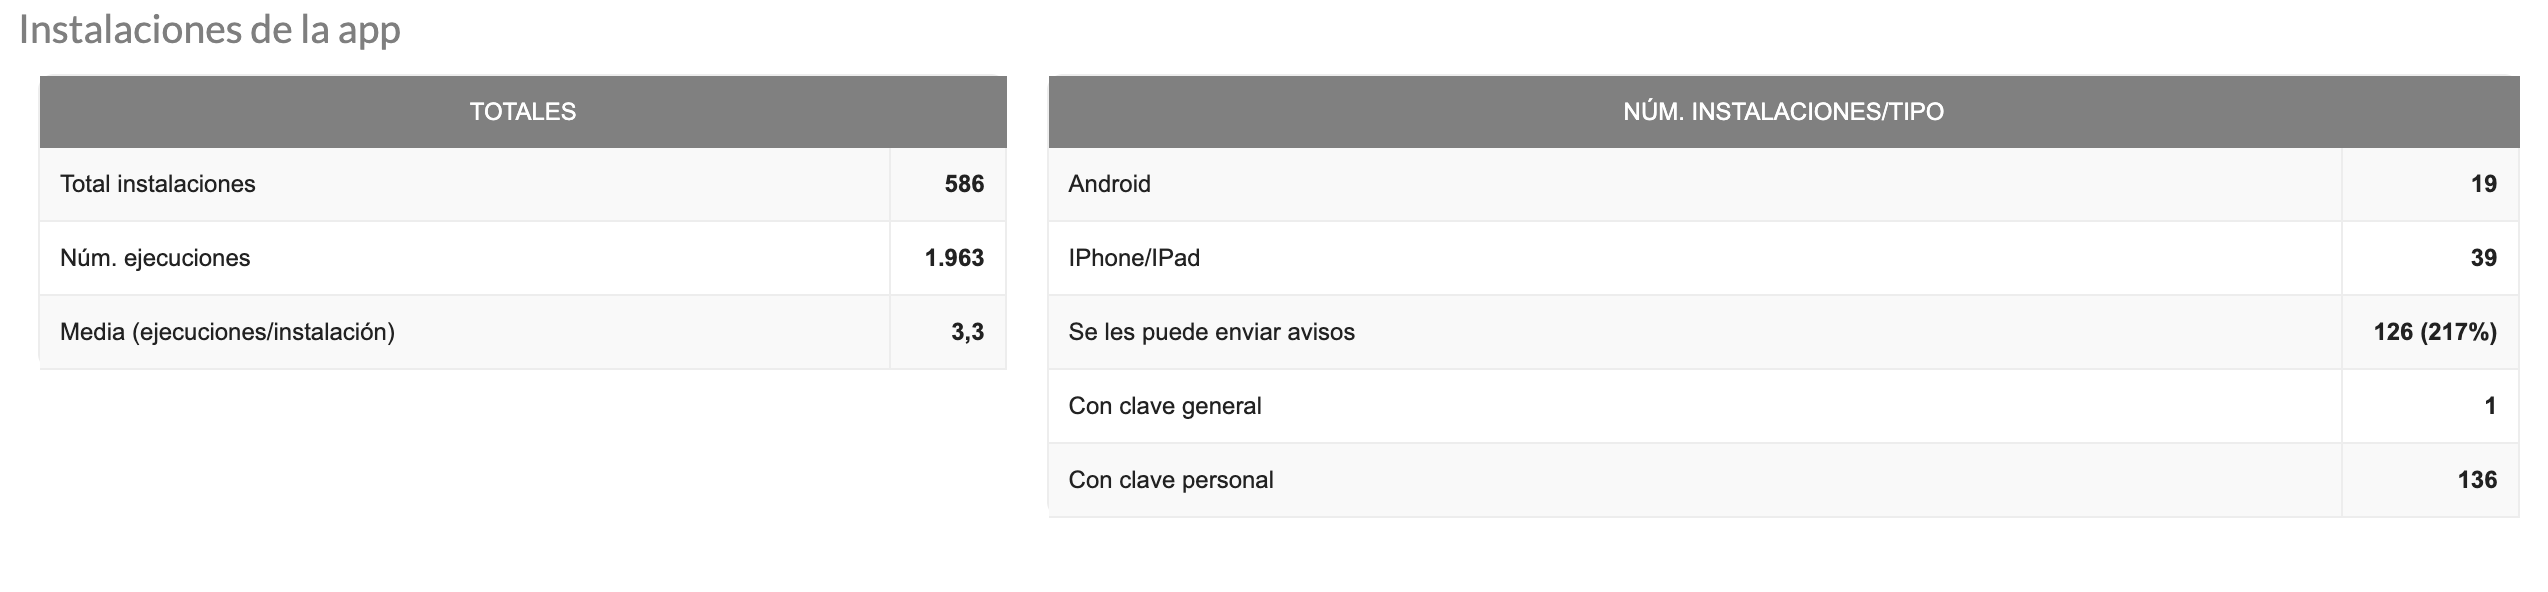
* **Total installations**: shows the total number of installations of the app on attendees' devices.
* **Number of executions**: indicates the number of times the app has been opened.
* **Average launches per installation**: This metric helps you understand how many times, on average, each user has used the app.
### **I**nstallations by device type
The right-hand column breaks down the types of devices and shows the installation data for each one. You can see how many users installed the app on **Android, iPhone/iPad**, and whether they have enabled the option to receive notifications.
You will also find additional metrics such as:
* **Users with a general or personal password** to access the app.
### **I**nteraction with speakers
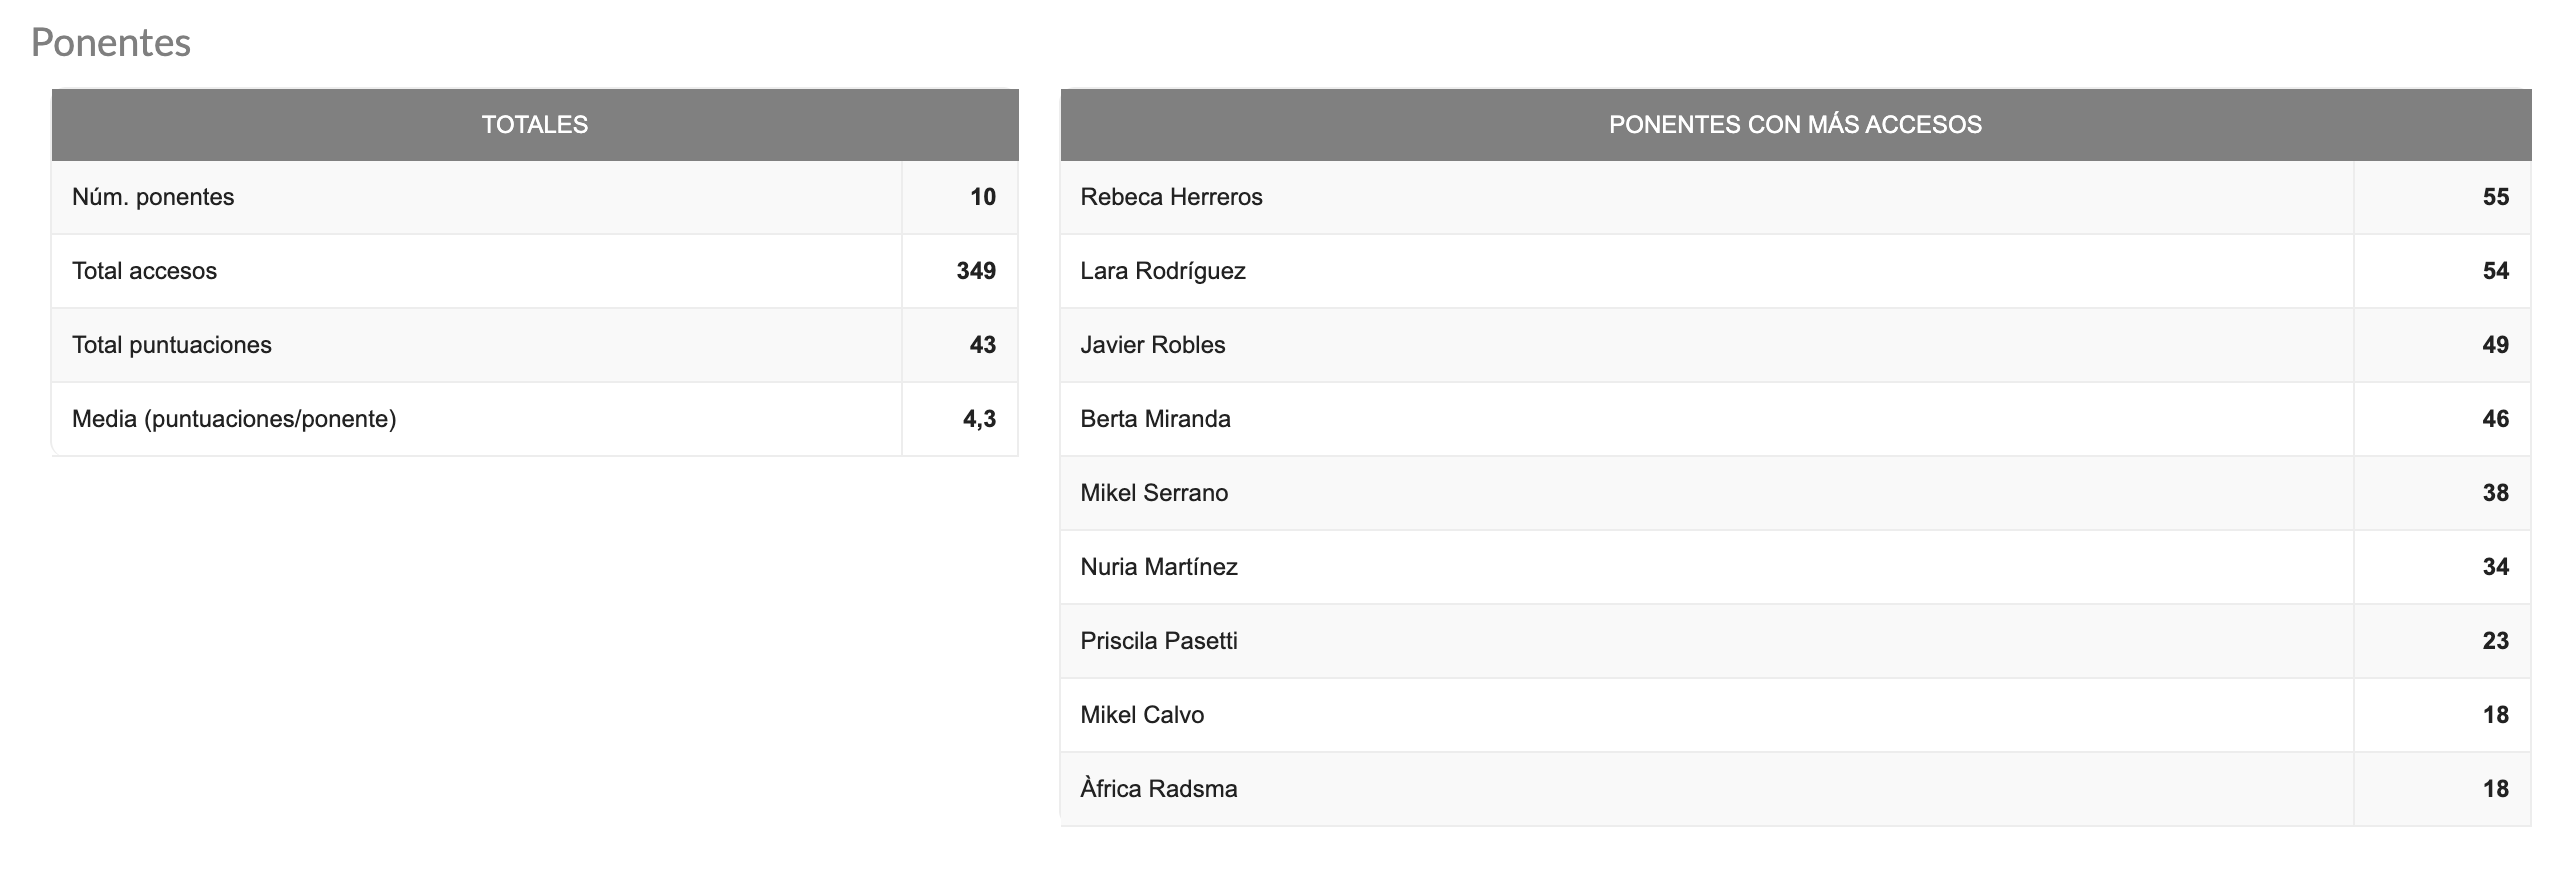
In the **Speakers** section, you will find information about the level of access and participation of attendees in relation to the event speakers. You will be able to see:
* **Total number of speakers.**
* **Total number of accesses** to the information provided by each speaker.
* **Total scores** given to speakers by attendees.
* **Average score** per speaker, which can serve as an indicator of popularity or evaluation.
In addition, a list of the **speakers with the most hits** is displayed, allowing you to identify the most popular ones or those who generated the most interest among attendees.
### Participation in sessions
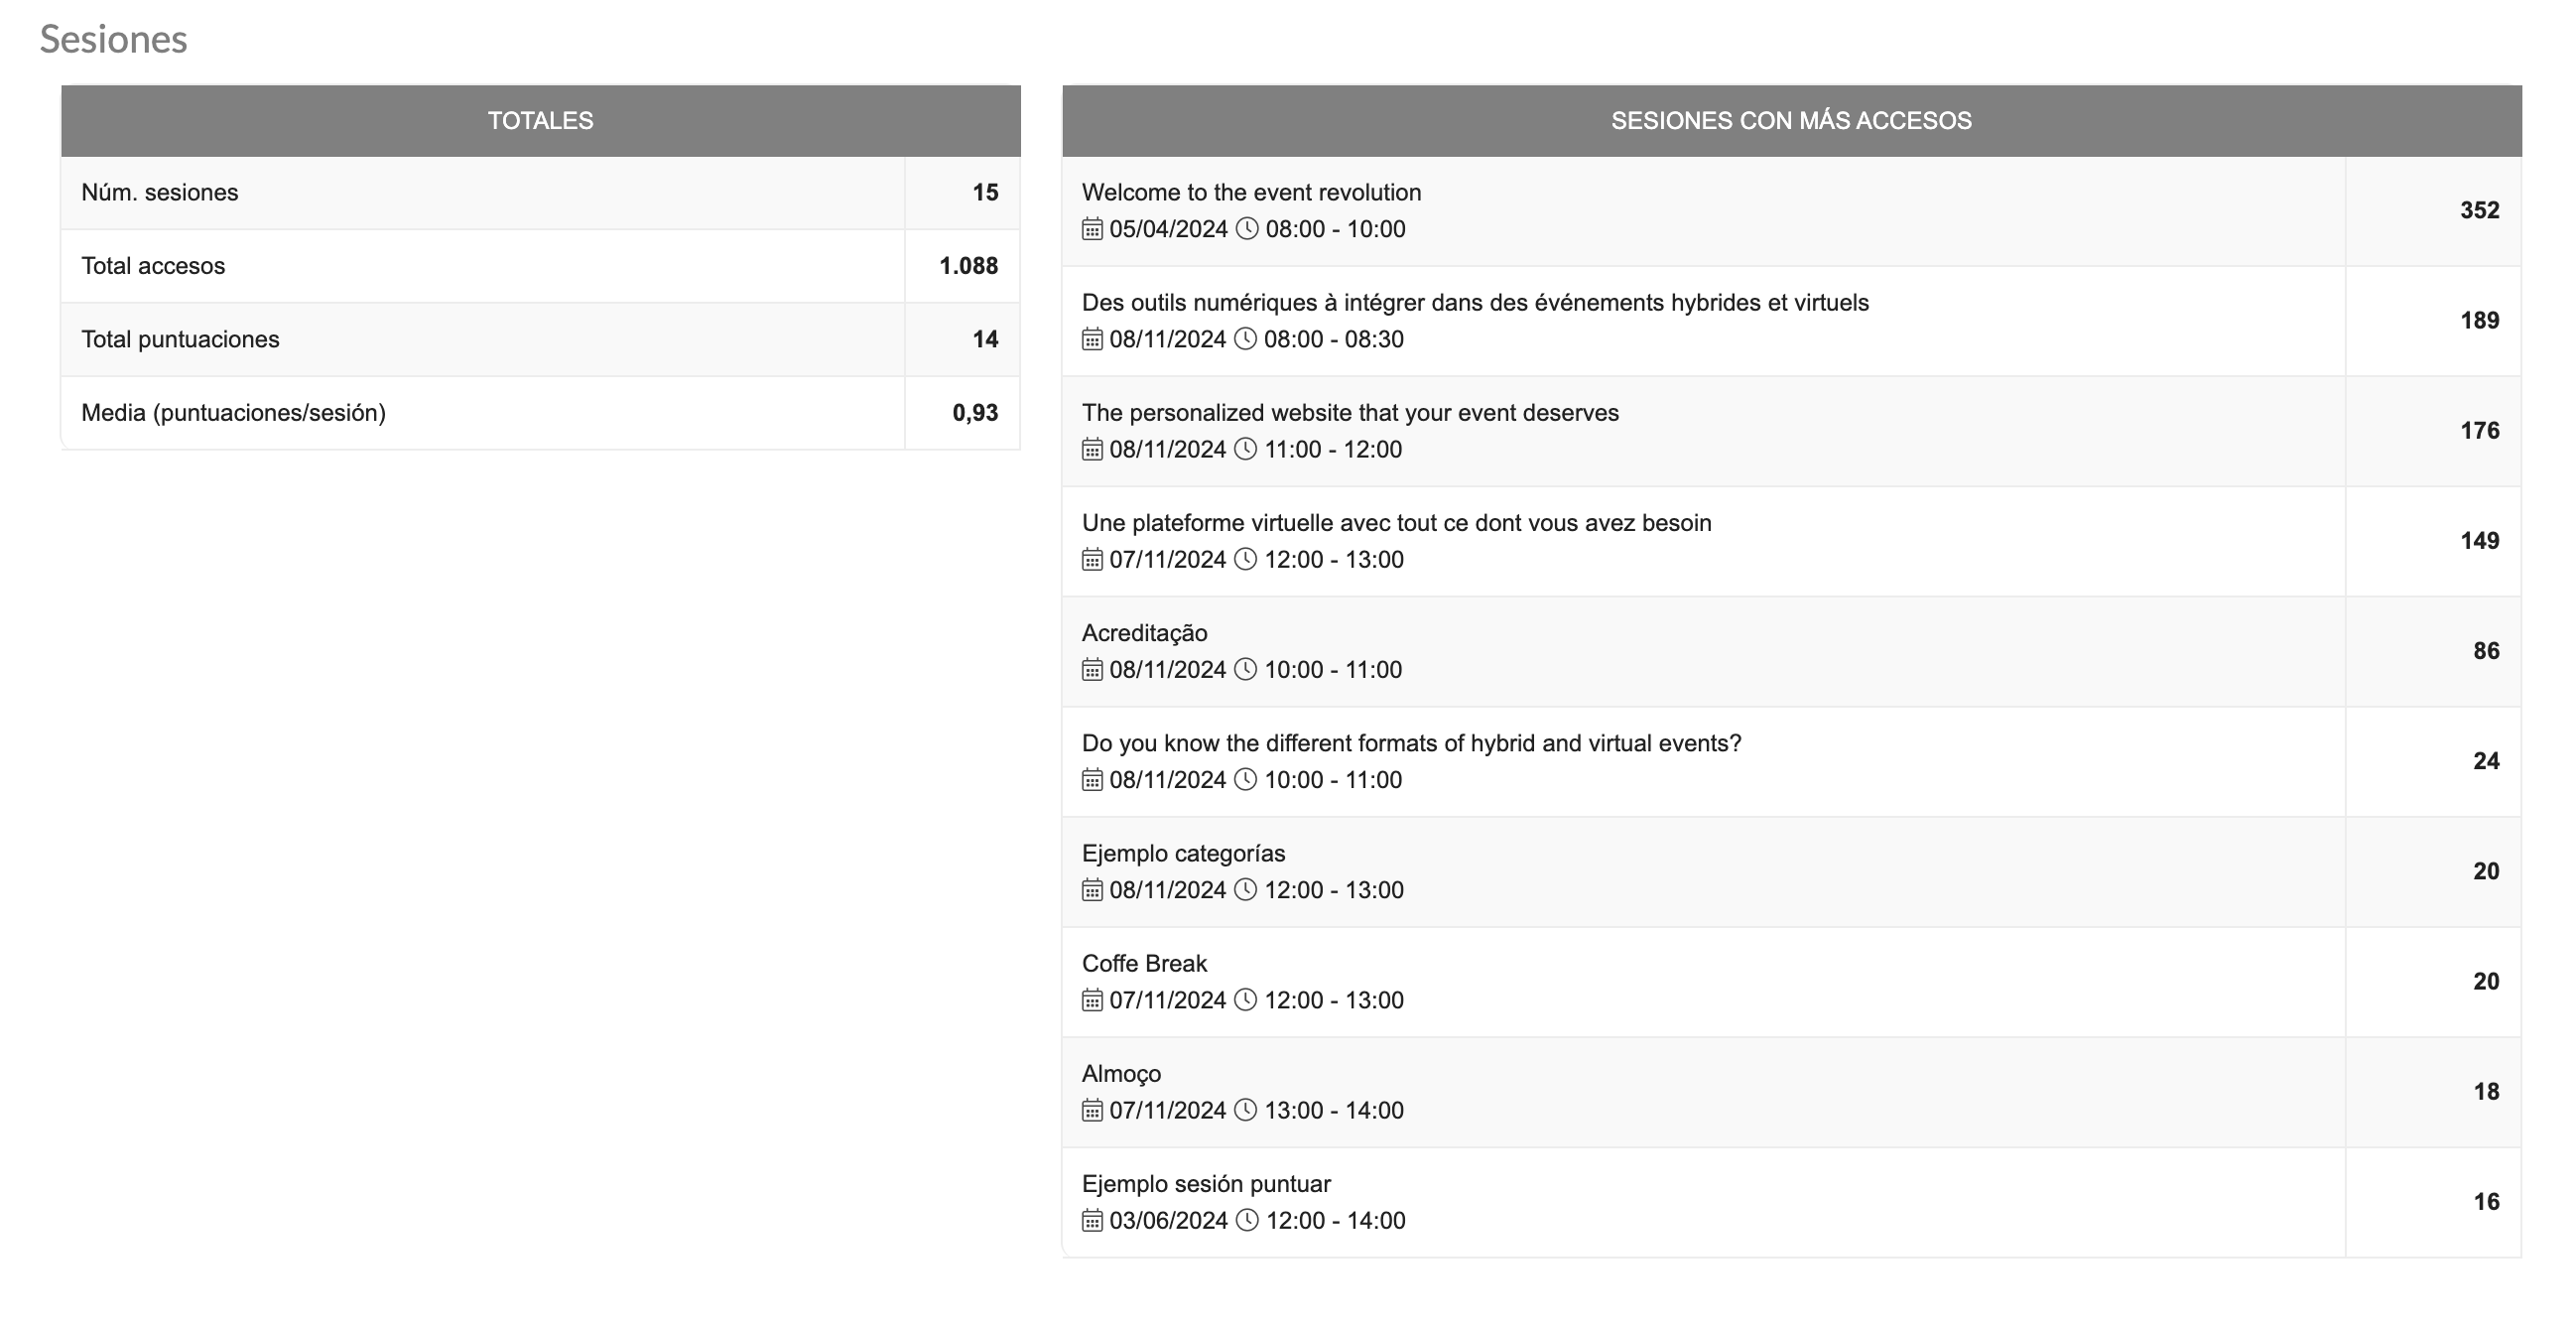
The **Sessions** section provides a breakdown of user participation in each session of the event. Here you can see:
* **Number of scheduled sessions**.
* **Total accesses** to each session.
* **Total scores** received and **average score** per session.
A list of the **most accessed sessions** is also displayed, so you can identify which ones have generated the most participation and adjust future editions of the event based on this data.
### Detailed information by category
The drop-down menu on the left-hand side allows you to access more specific statistics organised by category, such as:
* **General events**: includes general navigation statistics in the app.
* **Events agenda**: displays specific data about user interaction with the event agenda.
* **Events Exhibitors, Surveys, Places, Meetings, etc.**: these sections detail the use of specific app features, providing information on how attendees interact with exhibitors, complete surveys, review event places, and more.
Each of these categories allows you to analyse user behaviour in a specific way, facilitating decision-making when planning future events.
### Exporting and sending reports
If you need to share this data with other team members or keep a record outside the platform, you can use the **download** options at the top. You can:
* **Download** the report in web format or in the language of the event.
* **Email** a summary directly from the dashboard.
{% hint style="info" %}
The **App Usage Data** section in Eventool is a valuable tool for measuring the success of the different sections and activities of your event.Analysing this data will help you identify which sections generate the most interest and how to improve the experience for attendees at future events.
{% endhint %}