> For the complete documentation index, see [llms.txt](https://help.eventool.com/llms.txt). Markdown versions of documentation pages are available by appending `.md` to page URLs; this page is available as [Markdown](https://help.eventool.com/en/dashboard/analytics/installations.md).
# Installations
## What are installations and how can I analyse them?
In this section, we can **analyse the installations** that have been made of mobile applications.
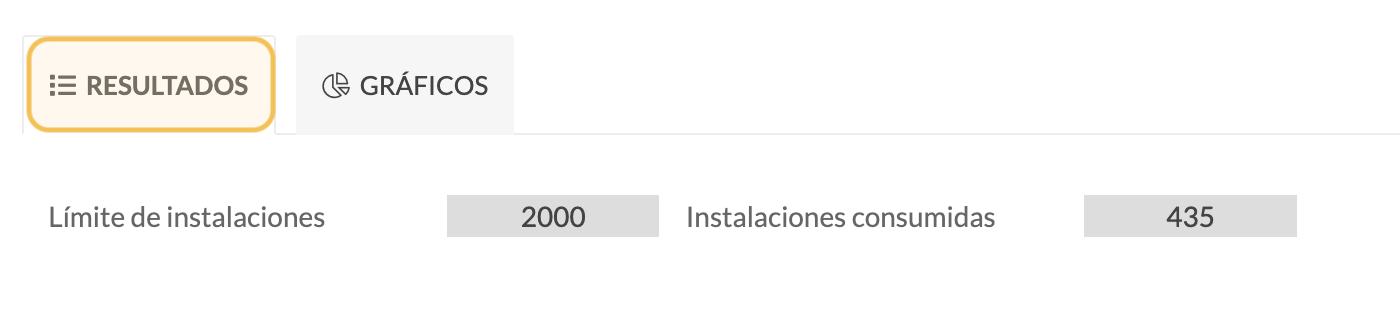
In the results section, we see the application **installation limit** and the **number of installations** already used.
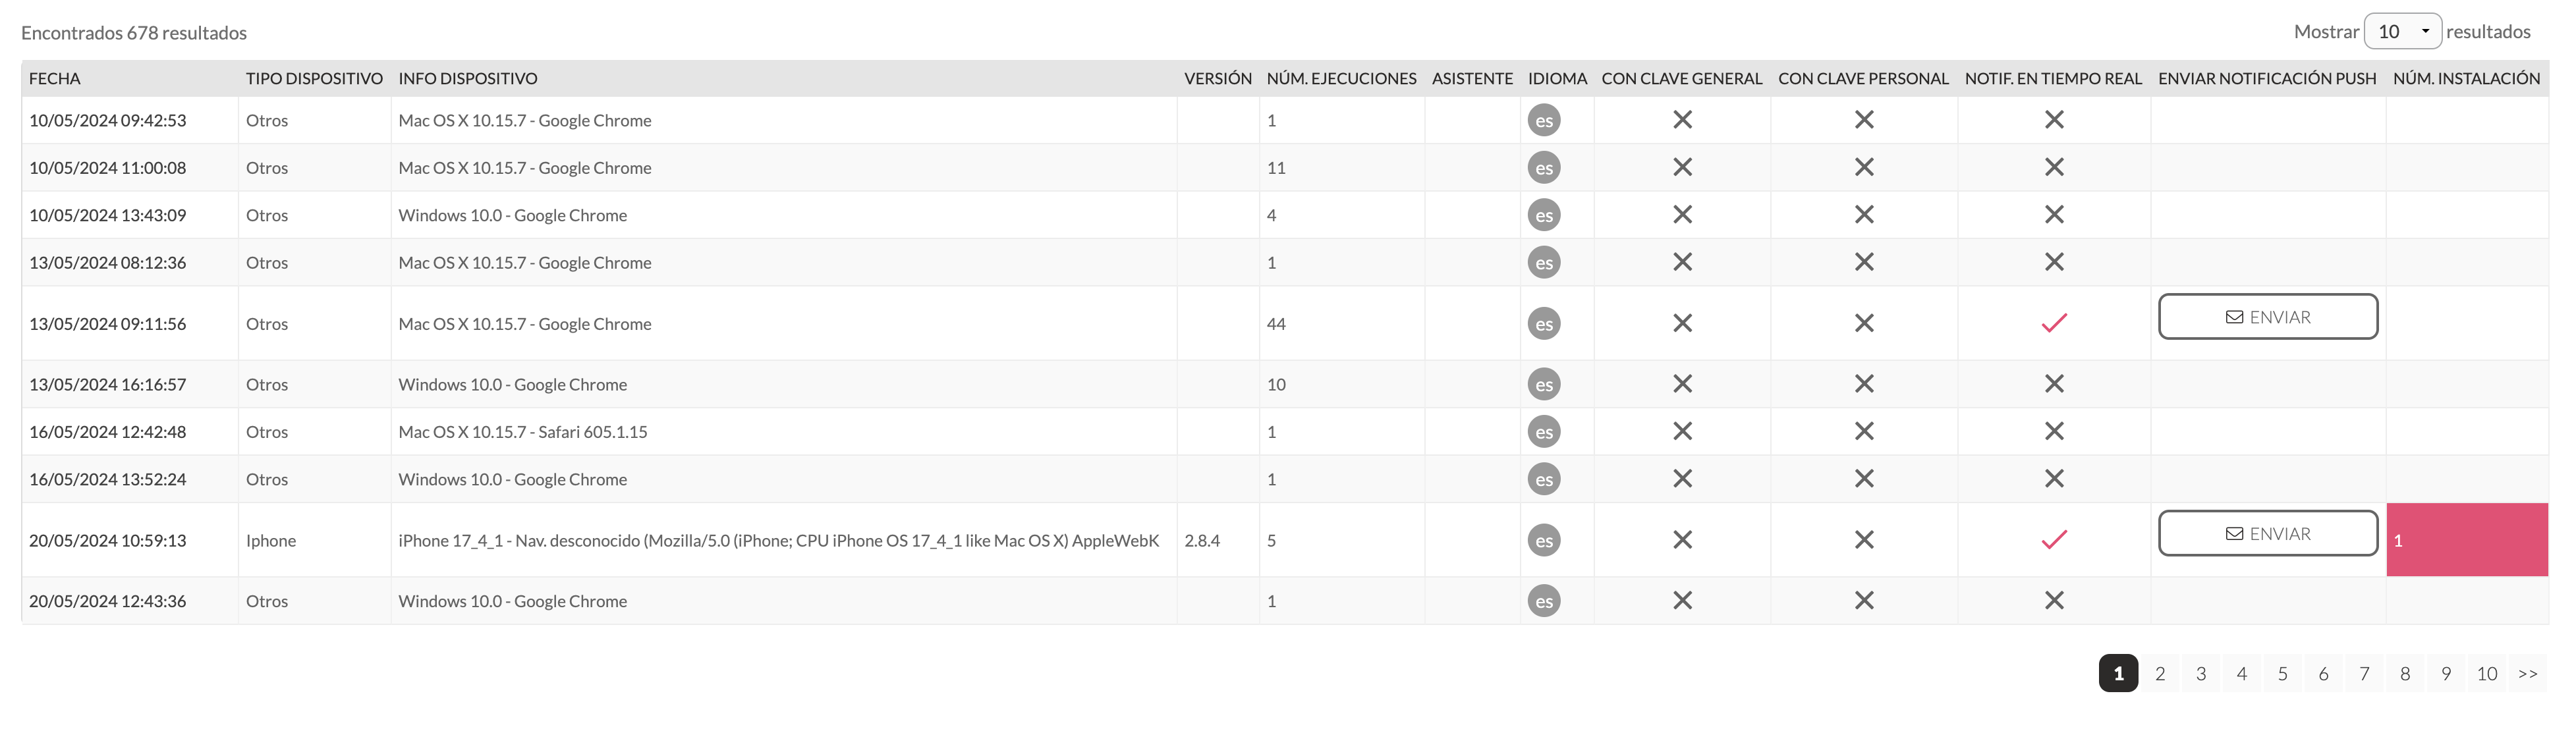
The following data can be analysed for each installation:
* **Date** of installation.
* **Device**: iPhone, Android mobile phone, or others.
* **Device information**: details the device model, for example: MAC OS X 10.15.7 - Safari.
* **Version**: the version number of the device's operating system.
* **Number of executions**: how many times the app has been accessed with one installation.
* **Assistant**: if the assistant is logged into the app, their name and email address will appear..
* **Language**: indicates the language used to access the site.
* **With general key**: if the event has a general key to access it without having to log in, it would be displayed here if you have accessed it in this way.
* **With personal password**: if the assistant has logged in with their personal password in the app.
* **Real-time notifications**: indicates whether the installation allows push notifications to be received.
* Send **push notification**: if you wish to send a push notification to a specific attendee, click Send and write a message to send only to that attendee.
* **Number of installations**: this is the number of installations that an assistant has performed.
All this information can be downloaded in Excel format.
### Graphics
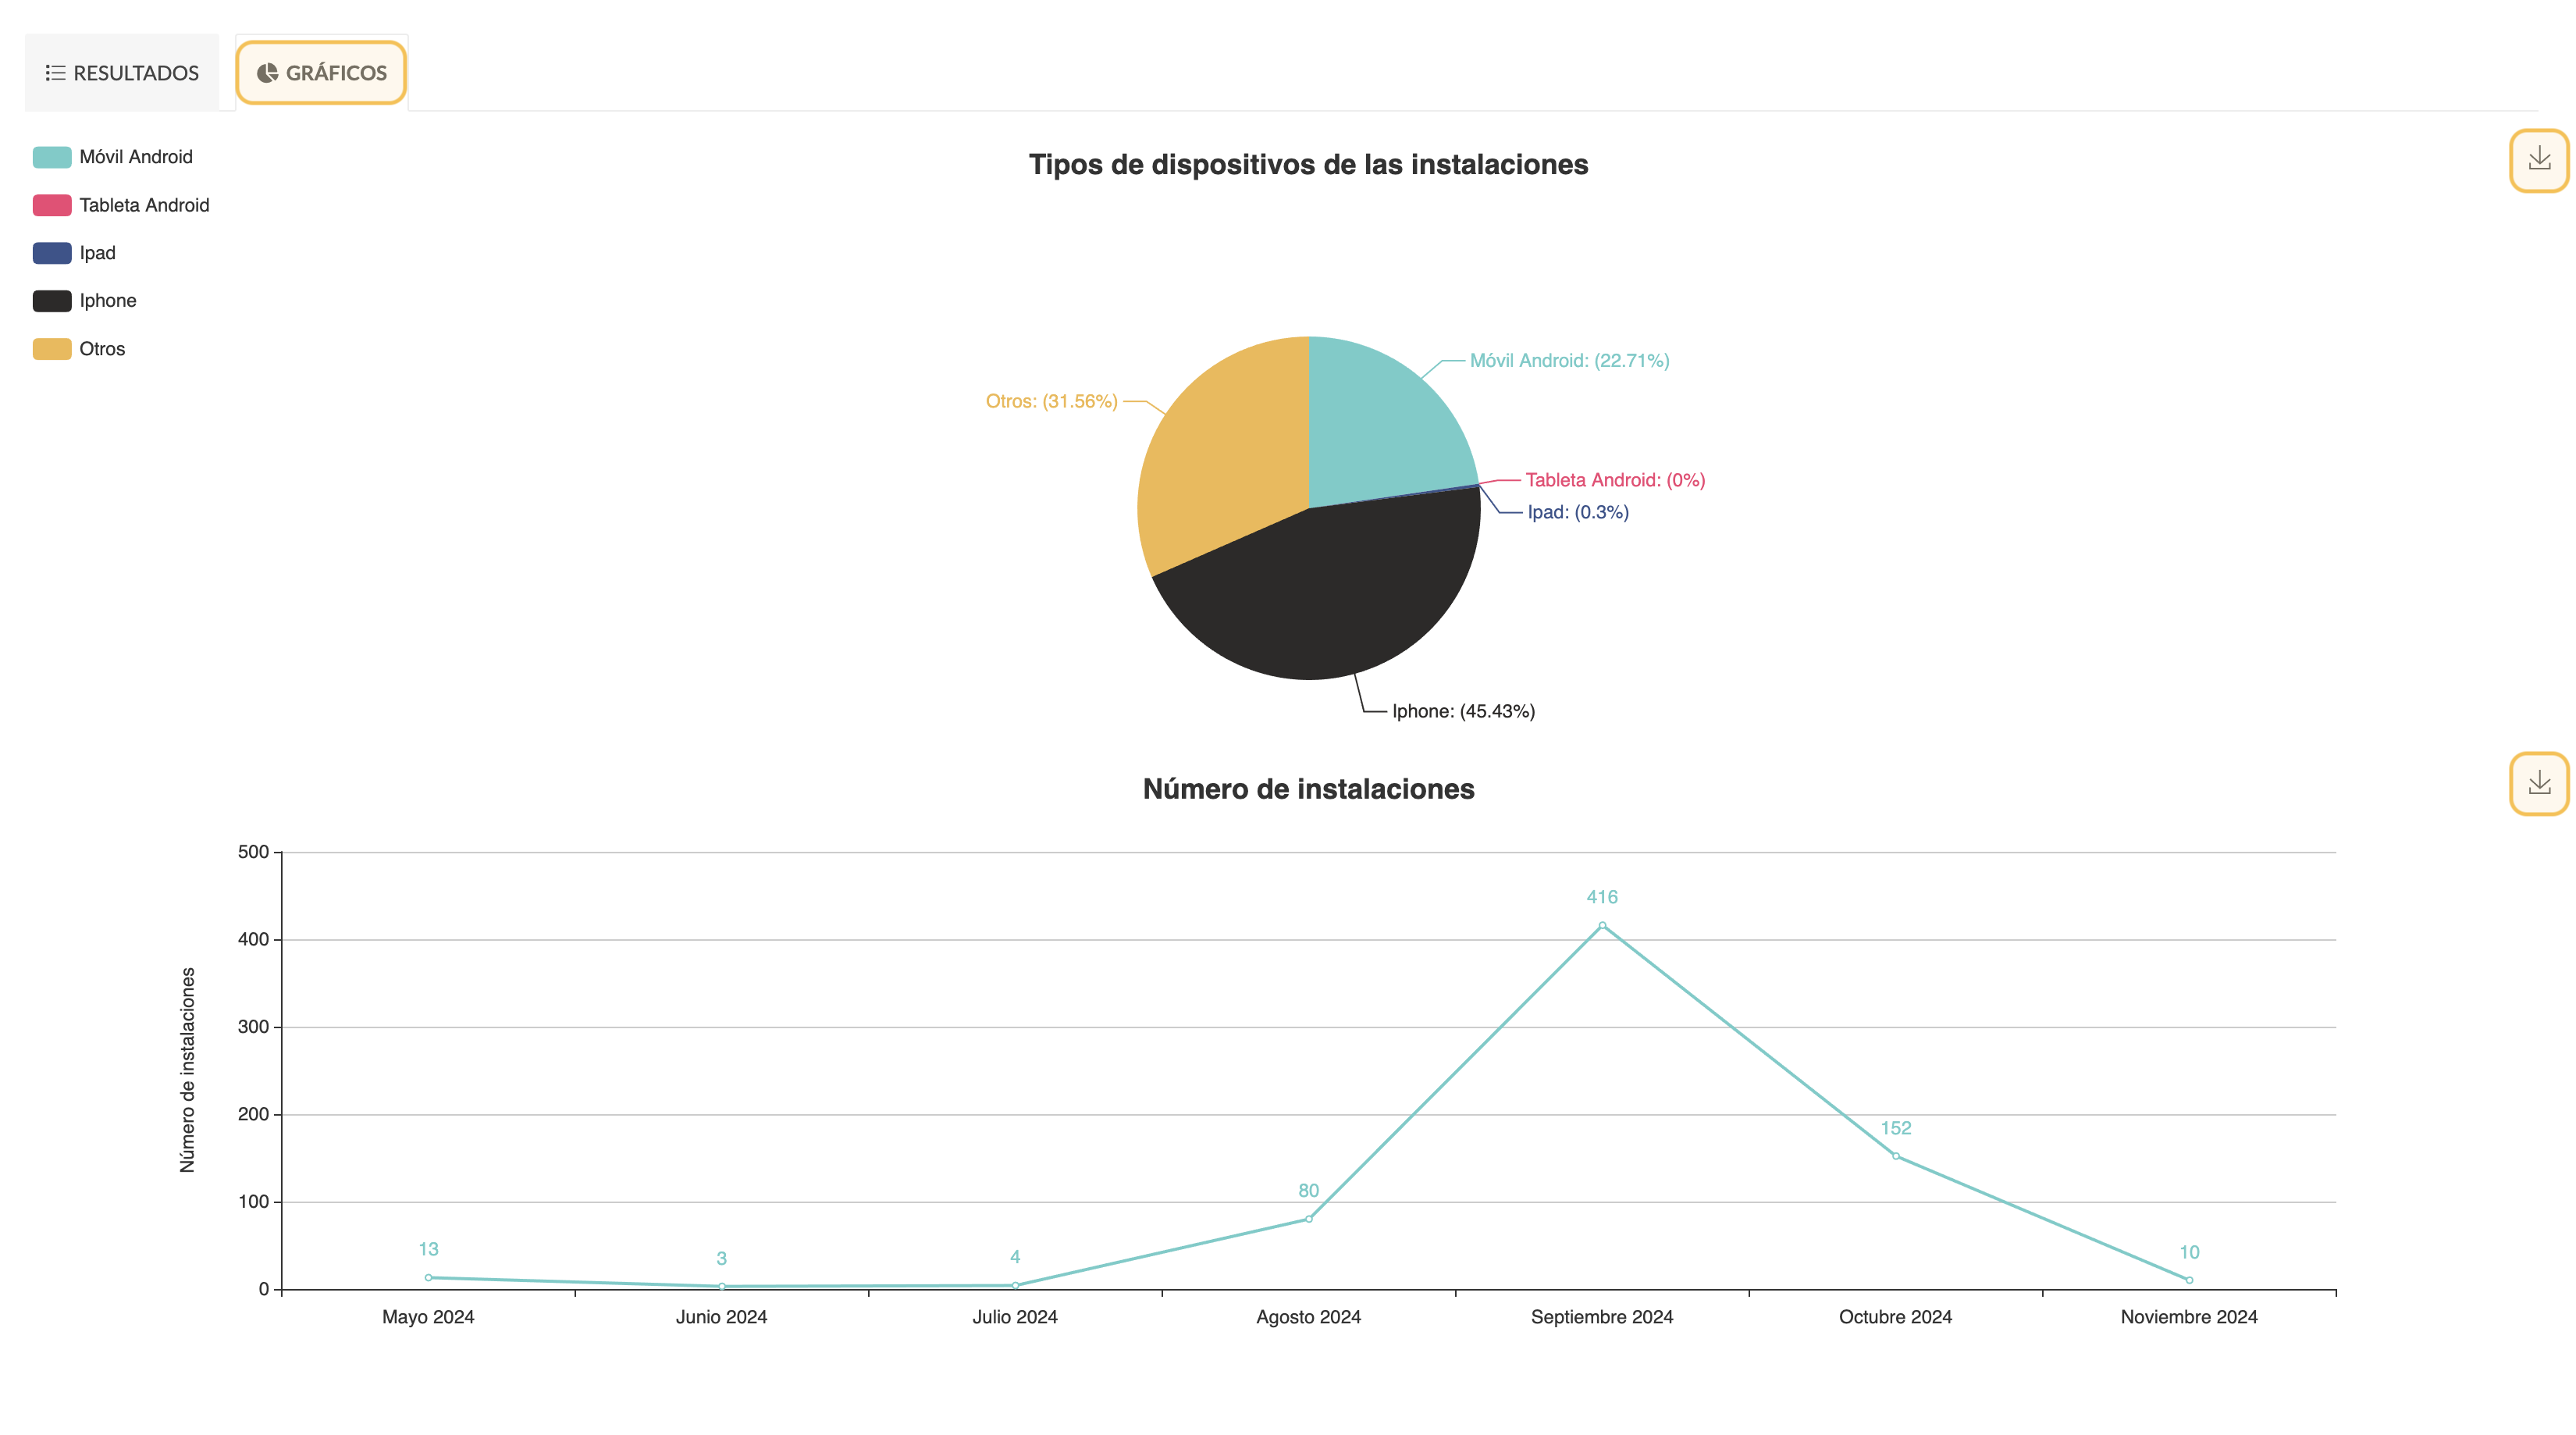
In this section, there are two graphs, which can be downloaded as images:
1. Type of devices in the installations
2. Number of installations.